
Developer log
1,000 players, one screen, zero lag spikes? We tried.
We threw 1,000 players on one screen and went after every millisecond: 46 ms down to about 22, a crowd trick from the original client, and the dead ends. Here is what worked and what did not.
By Xirune Team · November 3, 2026 · 39 min read · Updated November 3, 2026
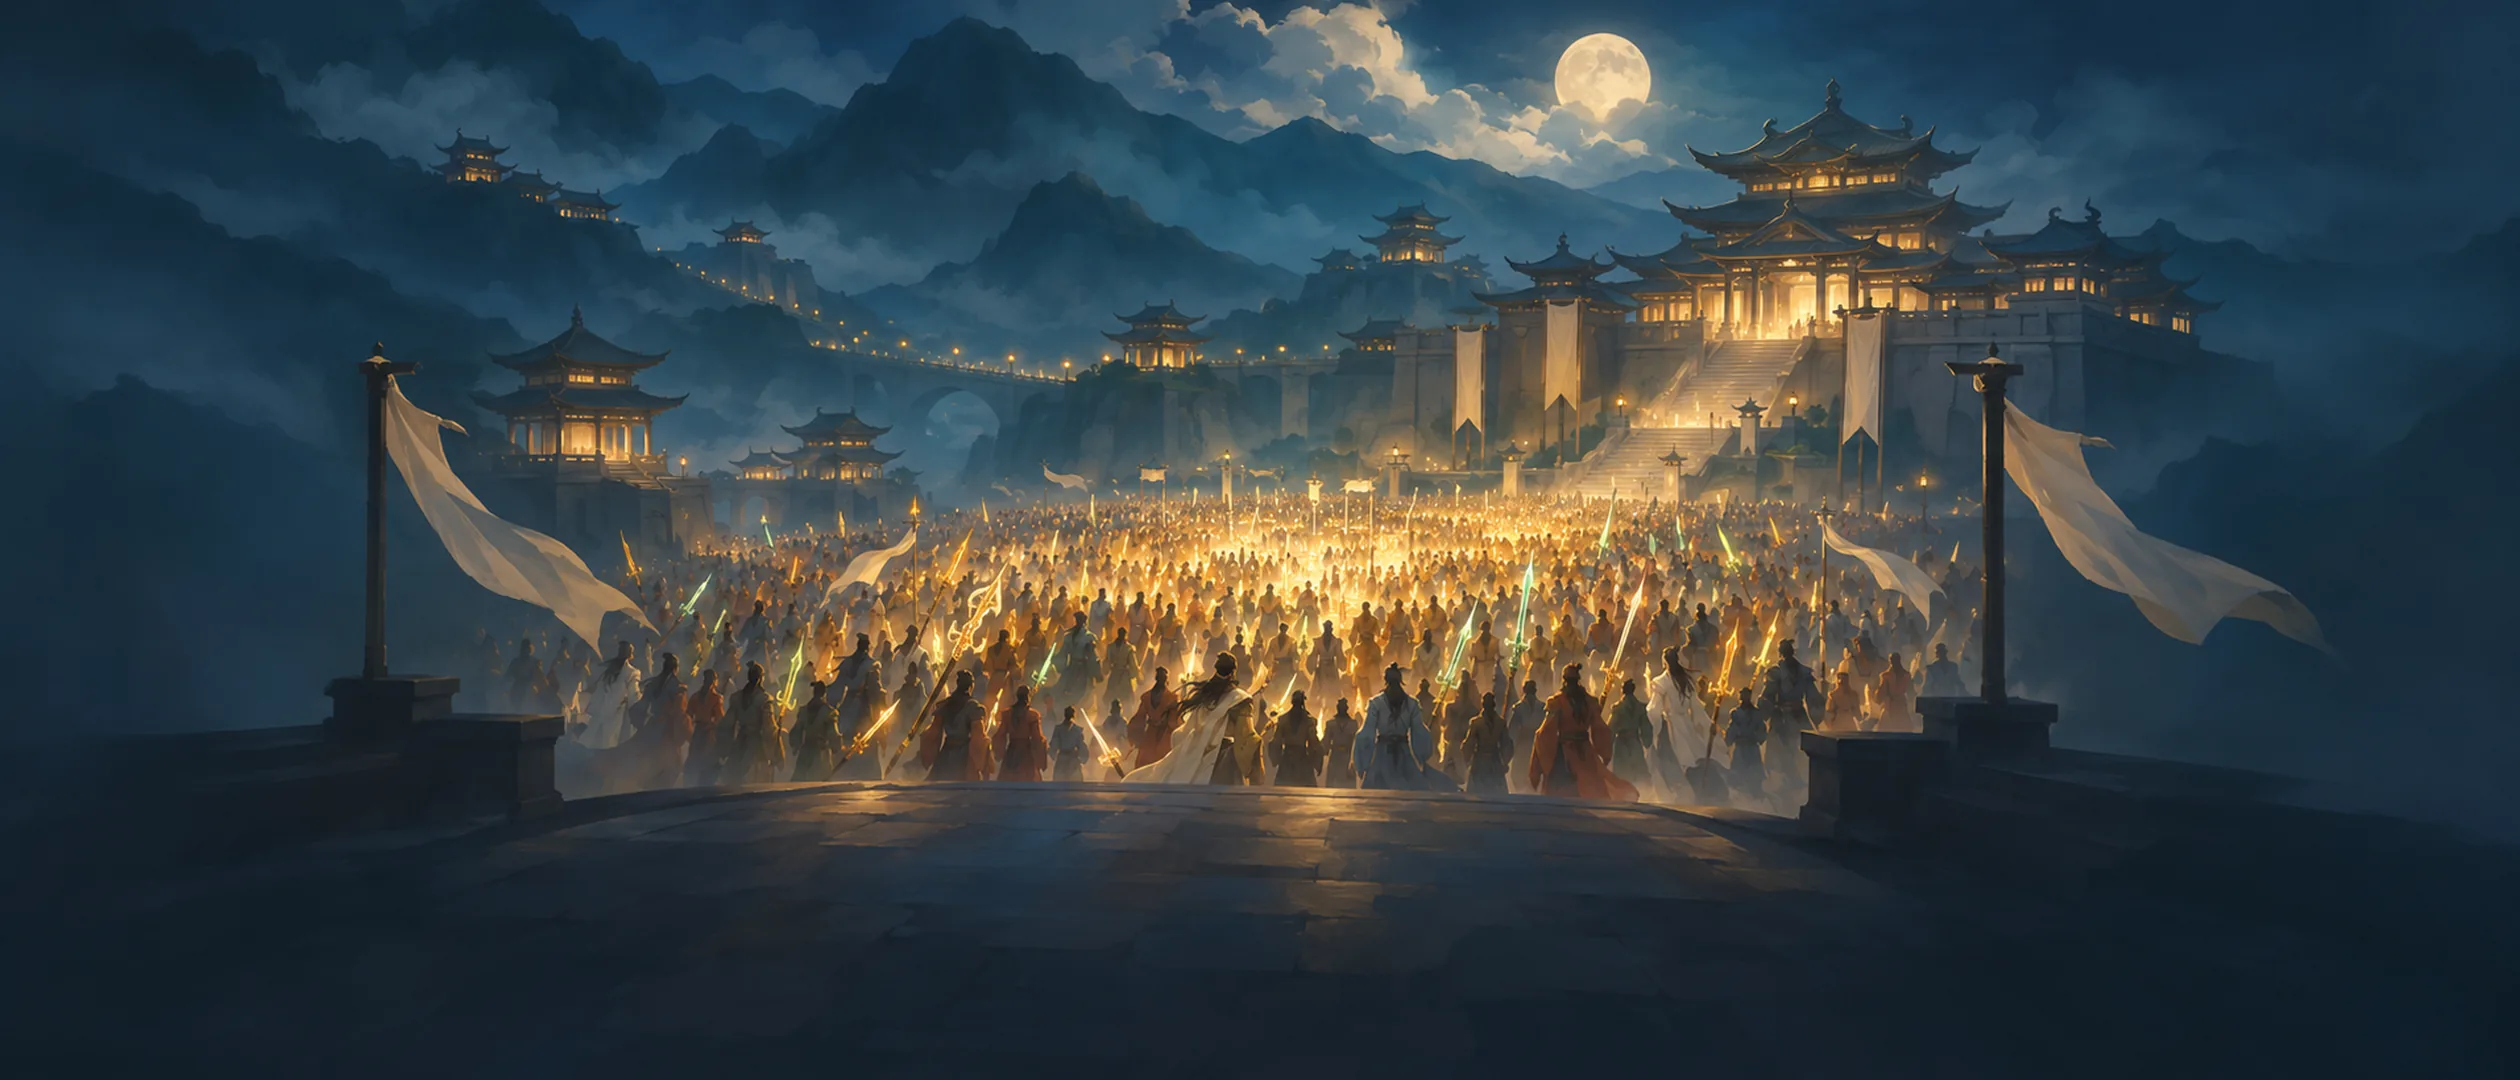
In our first 1,000-player test the client took 46 ms to draw a frame. On current main it takes 24 ms. The November 2 release got it to about 31 ms, and the work since then took it the rest of the way. This is the story of how, including everything that did not work.
Update, later on November 3: we kept going. The same 1,000-player moving scene now reads about 22 ms. Casts no longer build skeletons, and a new option from the original client makes a standing crowd of 1,000 cost 6.9 ms instead of 11.9 ms. The rest of the post was written before that pass and is left as it was. Jump to the second pass.
These improvements ship in game release 2026.11.4-1.
We are technical people writing for technical people here. If you build games, or you write Rust or Bevy, this one is for you. If you only want to know whether big crowds got smoother: yes, and the release notes for 2026.11.2-1 say so.
The short version
- The target was 144 FPS under load (6.94 ms a frame). We did not reach it. With 1,000 players moving, the client is at 24 ms on main.
- 1,000 players moving: 46 ms in our first test, about 31 ms in the November 2 release, 24.0 ms on current main.
- The clean comparison: on one rig, back to back, the release build read 37.1 ms and main read 24.0 ms, a 35 percent cut. The 46 ms and the 24 ms come from different sessions and rigs, so use that pair for the size of the gain.
- 200 players in Epic gear: 24.5 FPS up to 41.1 FPS in two days of work on the render side.
- An idle hero: 3.22 ms down to about 1.7 ms a frame.
- Second pass, same day: 1,000 moving players at 22.1 to 22.7 ms. With the new Number of 3D Models option on, 1,000 standing players cost 6.9 ms instead of 11.9 ms.
- Six experiments made things worse and were dropped. They get their own section, because they are most of what we learned.
Where we started
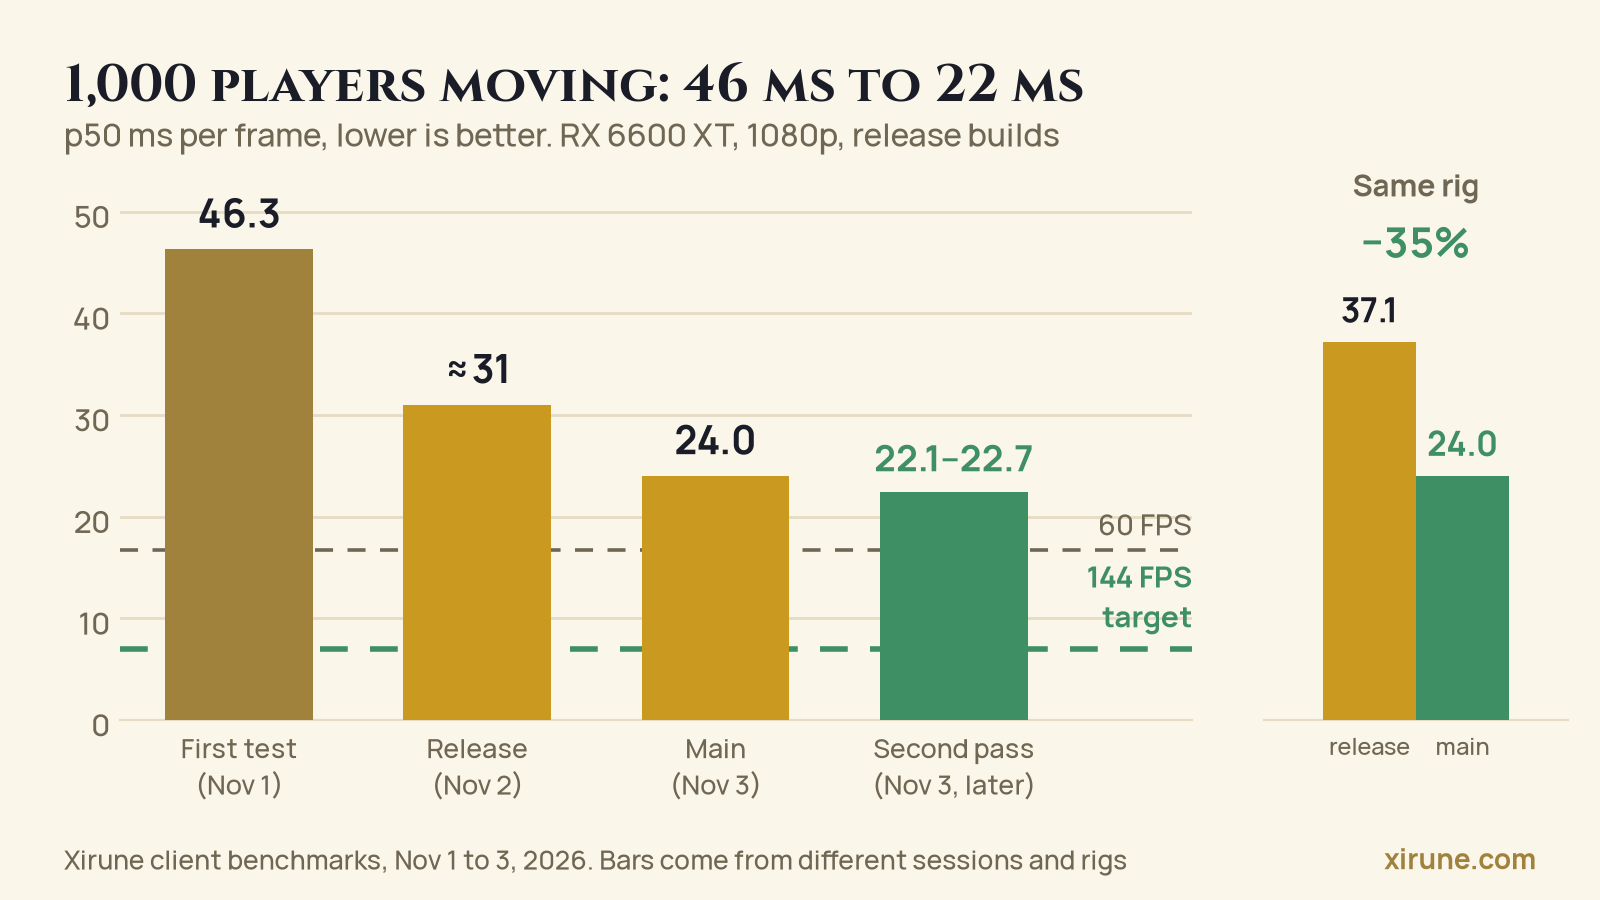
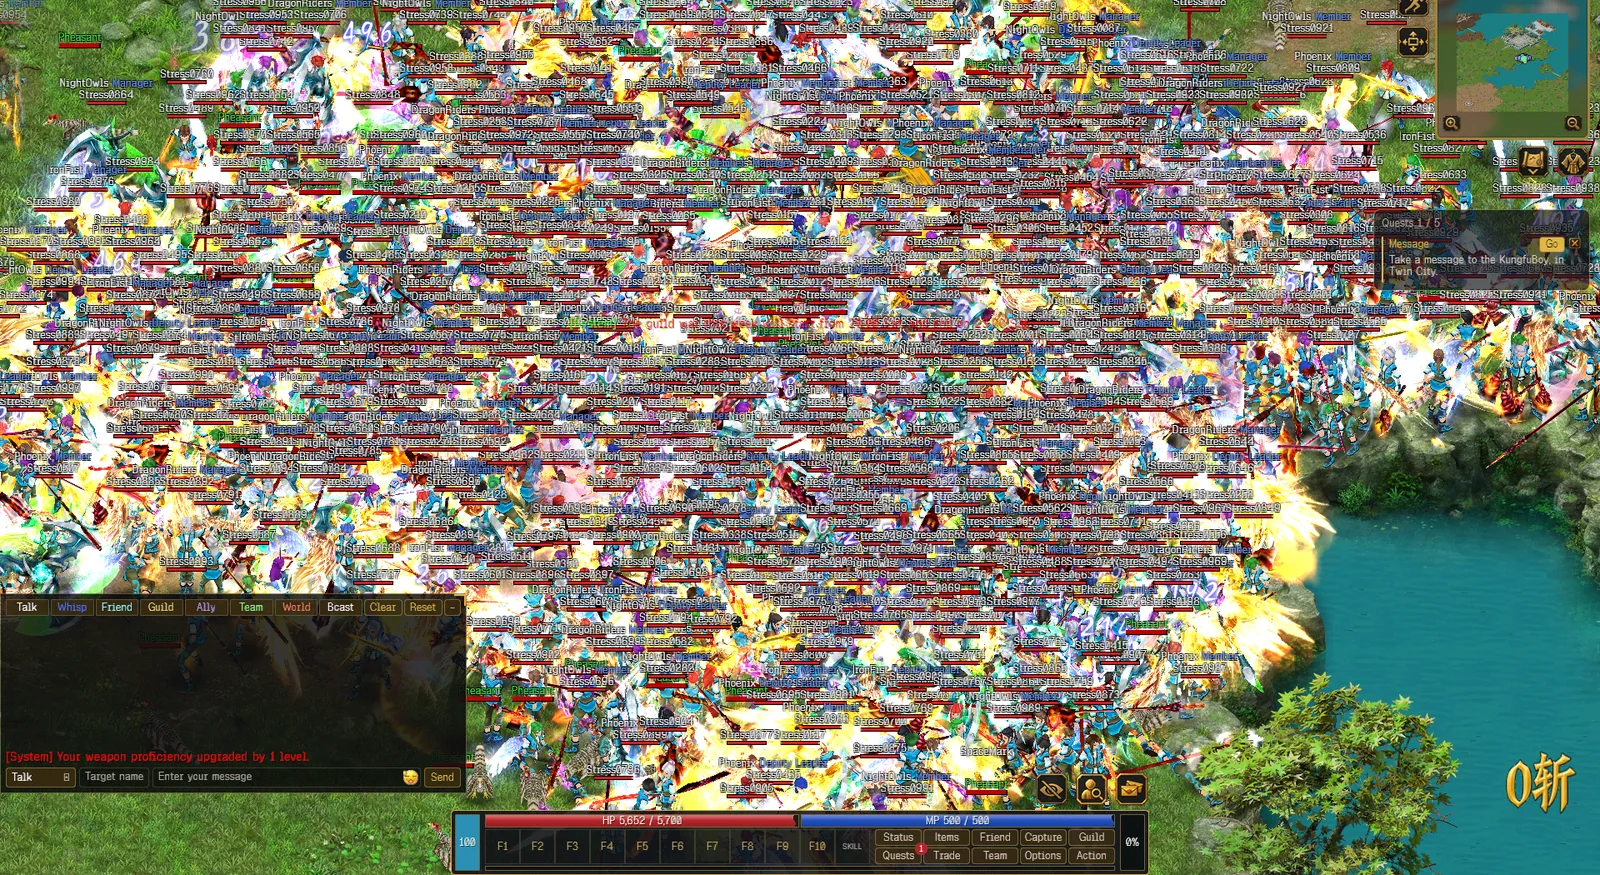
The Xirune client is written from scratch in Rust on Bevy. A fully geared character is expensive to draw. Weapons carry glow layers, trails and particle emitters, and wings add more parts. At 1,000 synthetic players with Epic effect gear the scene holds about 9,000 skinned meshes and 164,000 entities, roughly 164 for every player.
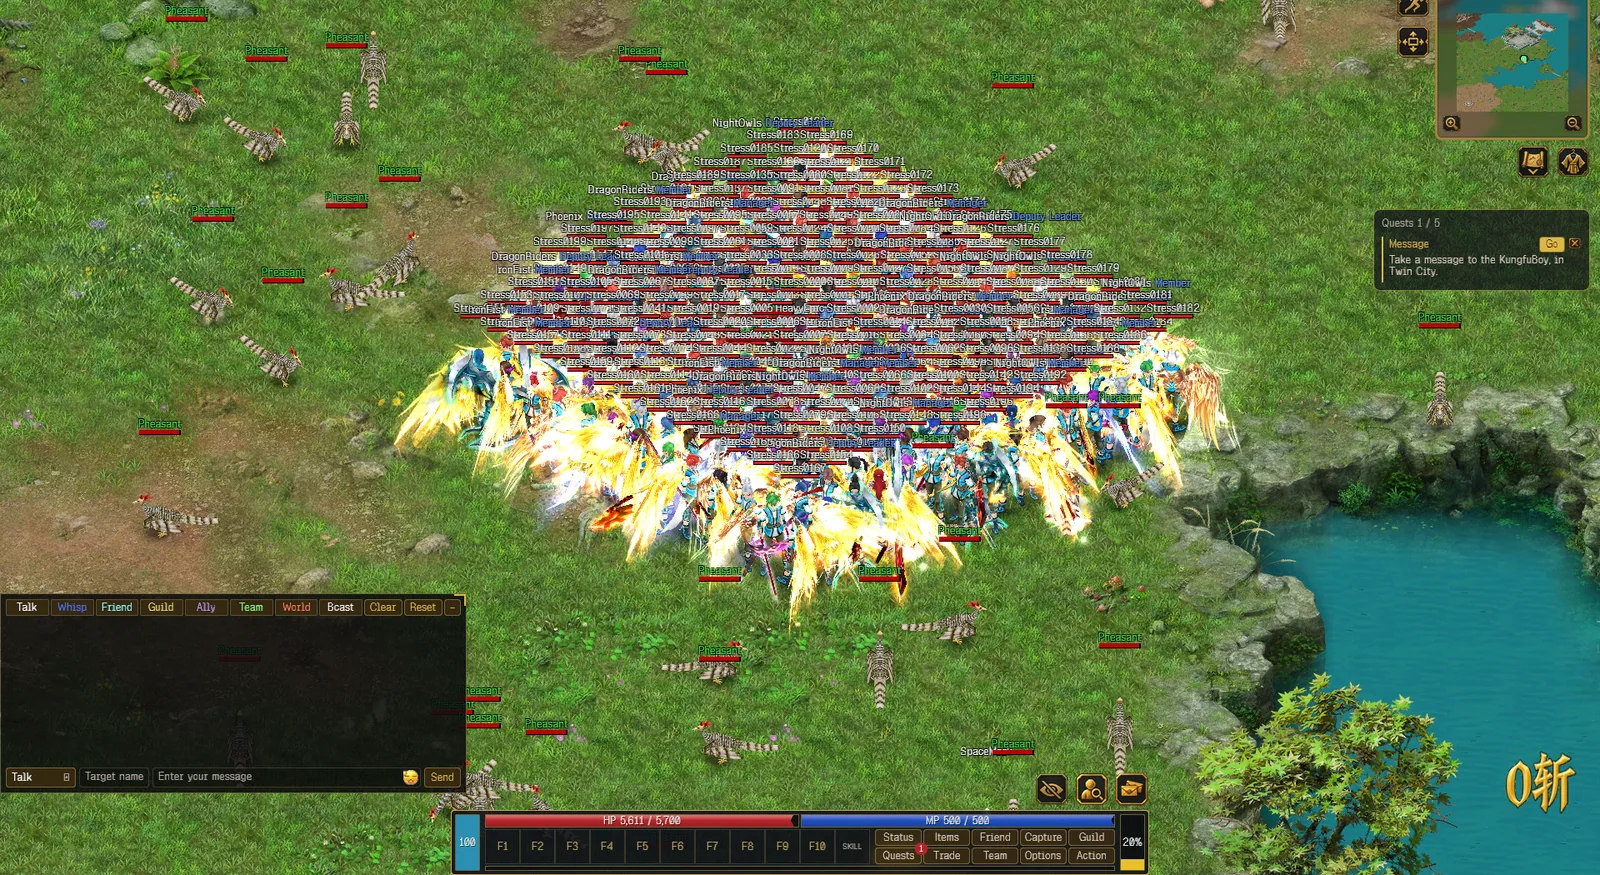
Nothing here is a synthetic trick. This is what a guild gathering looks like in the game we remember, and we want to draw it at a smooth frame rate on ordinary hardware.
The baseline on October 30 was 24.5 FPS with 200 Epic players standing still, and 32.8 FPS with 1,000 active players in plain gear. We set ourselves the target of 144 FPS with grade-9 weapon glows, Ninja Epic weapons, wings and heavy skills all on.
How we measure
We learned early that a speedup you cannot trust is worse than no speedup. These are the rules we ended up with. They are written down in the repository, so every change follows them.
- Frames, not HUD FPS. We keep every frame of a 30-second run, merge the raw frame history by frame number, reject gaps, and report p50, p95, p99, p99.9 and max. We also count the frames over budget. The first skill-use hitch stays in the data.
- Uninstrumented release first. Timing runs have no profiler, no recording and no other build running. We sample compiler and GPU activity to catch contamination.
- Profile separately. Traces are bounded (500 ms) and used to find hotspots, never to claim a win. Spans are not additive: nested and cross-thread spans overlap.
- One hypothesis per experiment. We name the hotspot, the redundant work and the expected saving. Candidates and baselines are separate builds, never runtime toggles. They run alternately, at least twice.
- Correctness before FPS. Every optimization needs proof that the picture did not change: exact probes that compare old and new results on millions of items, and screenshots for the rest.
- Test scenes with a contract. Same map, cell, viewport, zoom, equipment, player count and action rate every time.
The scenes we use most:
| Scene | What is on screen |
|---|---|
| Solo | One Ninja hero in Arena, nothing else |
| Normal-200 | 200 idle players in normal gear |
| Epic-30 | 30 idle players in Epic gear |
| E200 | 200 players, Epic gear and wing effects |
| E1000 / E1000s | 1,000 Epic players, moving and casting / standing still |
The crowds are synthetic World events, not 1,000 network clients, so they say nothing about server load. They do exercise the whole client: spawning, animation, draw order and effects.
Round one: stop drawing the same thing 21,900 times
The first measurements pointed at the render thread. Bevy submits one draw per mesh, and a character in Epic gear is dozens of meshes. With 200 players the client was making about 21,900 draw-function attempts a frame.
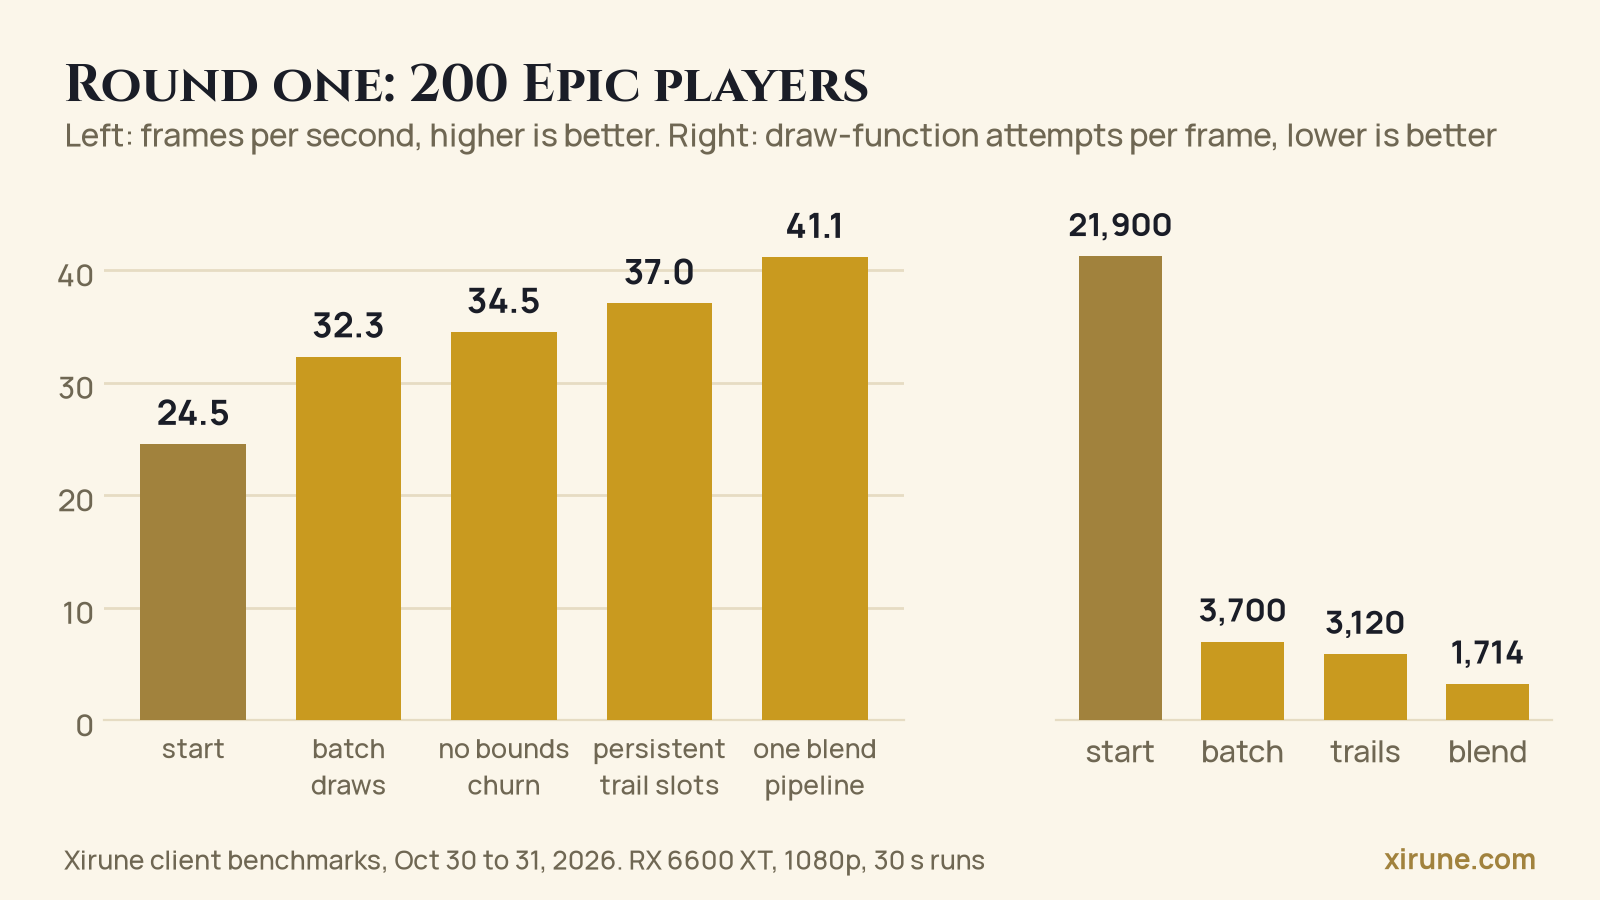
Multi-draw adjacent batches. We merge neighbouring effect draws that share a pipeline, a material slab and an index format into one multi-draw. The order of the draws does not change: Xirune must draw in the same order as the original game, and a faster picture that is drawn in the wrong order is a bug. That took the draw count from about 21,900 to 3,700 and gave 26 to 32 percent more FPS.
Our first attempt only handled 32-bit indices. Most of our meshes use 16-bit indices, so almost nothing merged, and the scene got slower, at about 23.5 FPS. We fixed the coverage and measured again.
Stop recomputing skinned bounds. Attached weapon-effect layers now skip frustum culling instead of recomputing an animated bounding box every frame. Epic-200 gained 6 to 11 percent, and the p99 improved.
Skip work that did not change. The character motion profile was refreshed for every player every frame. We now refresh it only when an appearance input changes, and the refresh cost fell from 8.4 ms to 1.6 ms per call. In the 1,000-player scene that was about 19 percent more throughput. We checked it against 1,057,028 live action timings, with zero mismatches.
Stream trails into persistent GPU slots. Every weapon trail used to rebuild its whole vertex buffer, and about 409 mesh assets a frame were marked modified. Trails now own a stable slot in a GPU buffer, and only the changed slices are written. Mesh modifications fell to zero and Epic-200 gained about 10 percent. To be sure we had not changed a single vertex, we compared 256,976,130 CPU-side vertices bit for bit against the GPU contents.
One blend pipeline. Alpha-blended and additive effect layers used different GPU pipelines, so every switch ended a merged draw. We moved them onto one pipeline using dual-source blending where the GPU supports it, and kept the original blend equations. Draws fell from about 3,130 to 1,714 and Epic-200 gained 9 to 11 percent. Two days later we found a way that needs no special GPU feature. We will come back to it.
The trap: some of our wins were bugs
Early on, a few of our best results were fake. A shared shader library was built into the game but never registered, so the glows were not being drawn. Fewer pixels, more FPS. Every result from before the fix was thrown away, and only runs that carry the label “glow-fixed” count.
This is why correctness is a rule and not a courtesy. An empty or failed effect pipeline looks exactly like a huge performance win. We now check that the equipped gear is loaded, the glow layers exist, the pipelines are ready and the particles play, before we look at the frame time.
The harness lied to us as well. The rich status call we used to inspect the scene cost 9 to 28 ms per call at 1,000 players, which looks exactly like a cast hitch. Our solo p99 of about 5 ms included the cost of the census. After we split cheap polling from rich snapshots, the corrected solo baseline became 316.9 FPS with a p99 of 3.9 ms. We had to correct a baseline before we could improve it.
Round two: fewer passes per frame
Rendering is not only draw calls. We looked at the structure of one frame and found a lot of work that looked cheap in isolation:
- three 3D views even in the solo scene: the role camera, a separate camera for the terrain tiles, and a full-window offscreen camera for screen effects (the KO counter, XP fire, Divine beads)
- more cameras and window-sized targets while damage numbers or buff icons were on screen
- 4x MSAA on the world cameras, which meant a resolve per view
- four upscaling blits to the window
We folded all of it into a single world pass. The terrain tiles, the damage numbers and the screen effects became ordinary transparent items of the one gameplay camera, sorted by the same painter order as everything else. Buff icons draw from one small atlas. Anti-aliasing is off by default, and the option remains.
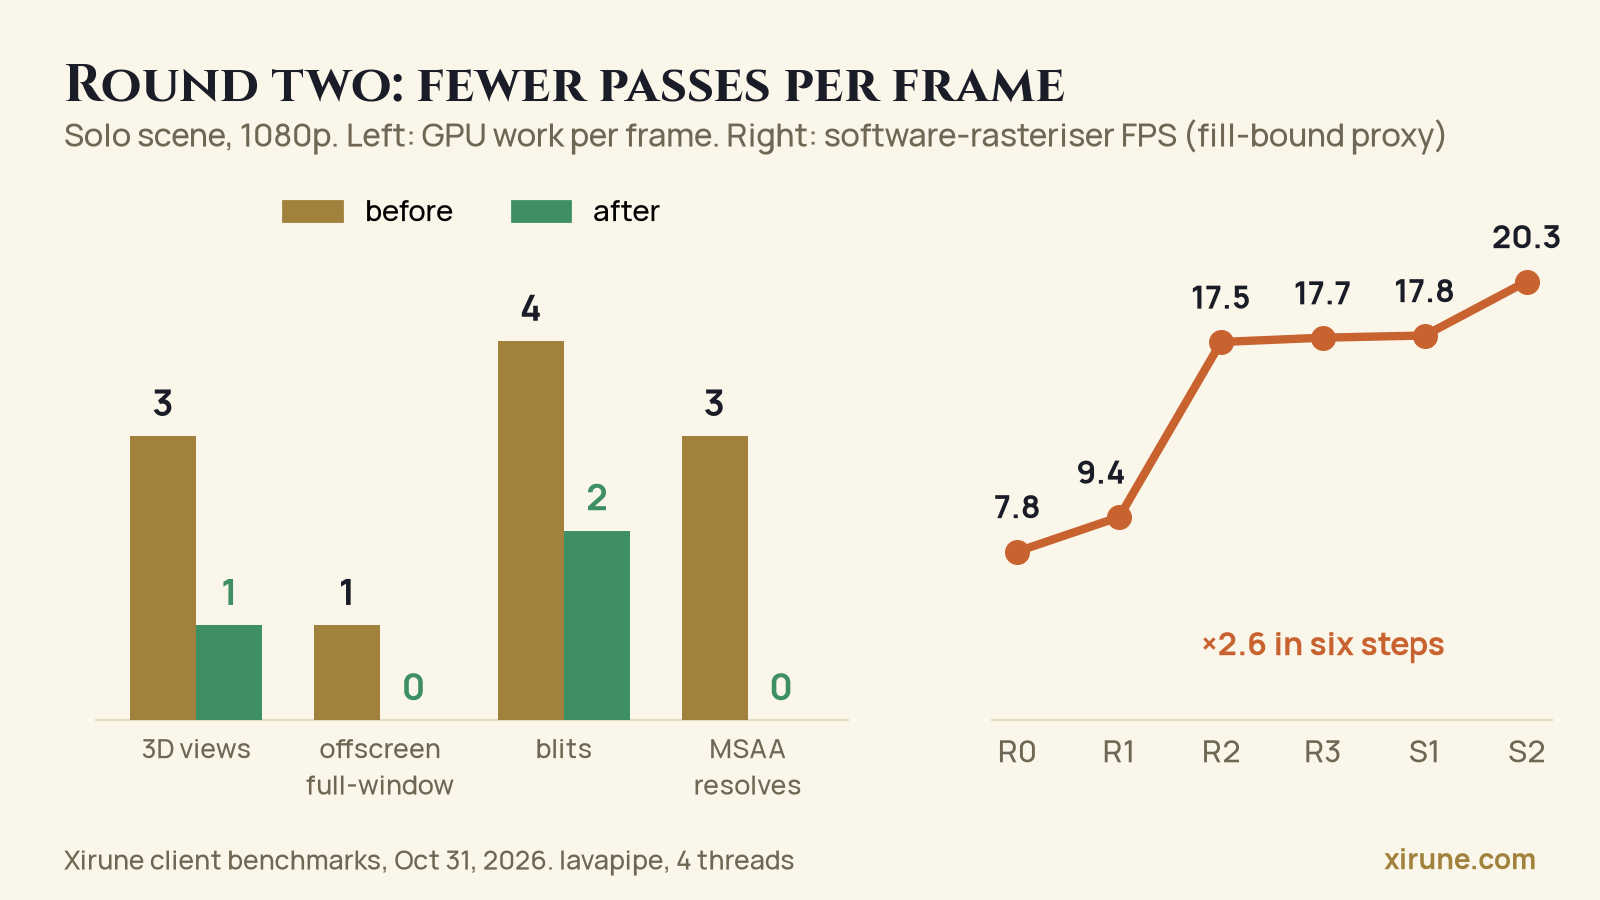
On our RX 6600 XT this barely moves the frame time, because that card is waiting for the CPU. The structure shows up when the GPU is the bottleneck. We used a software rasteriser (lavapipe) as a fill-bound proxy for weak hardware, and it went from 7.8 to 20.3 FPS in the solo scene. The 6600 XT still improved: Normal-200 went from 147 to 175 FPS, and Epic-30 from 145 to 165.
Two traps are worth sharing, because they apply to anyone writing a custom Bevy render schedule.
A frozen frame can hide a stale buffer. The world camera now runs its own render schedule. If it skips the GPU mesh preprocessing step, the camera reads stale instance data, and a paused screenshot looks perfect. The picture only breaks when things move. A negative control, our first broken build, differed from the good one by 437,000 to 691,000 pixels on a moving crowd. We now prove render changes on moving content, as well as on frozen frames.
The right pixels can still be seven times too slow. If the schedule skips building the indirect draw parameters, the output is identical, but on the software rasteriser with a moving 200-player crowd a frame took 3.5 to 4.2 seconds instead of 0.53 seconds.
One dead end belongs here. We built a render-scale option. Bevy’s stock resolution override only shrinks the viewport inside a full-size texture, so it shows the top-left corner of the scene. We shrank the camera target in the render world instead. A 75 percent scale looked uneven because the stock upscaler does not filter, so only 100 and 50 percent stayed.
Round three: the frame when nothing happens
With the render side calmer, the idle hero scene still took about 3 ms. A profile showed no heavy system. It showed roughly a thousand systems running every frame in the Update schedule alone, nearly all of them with nothing to do.
So we measured what an idle system costs: about 0.63 microseconds to dispatch. About 800 of 953 Update systems took under a microsecond. That sounds like nothing. At that count Update costs about 0.6 ms of a frame that is itself about 2 ms.
What worked, in the order we found it:
- Park hidden windows properly. Closed windows were already out of layout, but every UI node requires a
Visibilitycomponent, and Bevy’s visibility systems walk every entity that has one. We stripVisibility,InheritedVisibilityandViewVisibilityfrom a parked window subtree and keep the original in aDormantVisibilitycomponent, to restore on open. Entities with visibility dropped from 2,398 to 990, and the solo frame went from about 2.55 ms to 2.30 ms. We tried despawning the windows first. That lost their state and did not help, because the cost was the walk, not the entities. - Spawn UI nodes on demand. Each reachable node costs about 0.5 microseconds a frame, hidden or not. Buff icons and minimap markers now exist only while they are needed. Dropping 168 always-present buff icon nodes bought 0.09 ms.
- Compare before writing. Bevy marks a component changed on any mutable dereference, even when the value is equal, and layout and extraction redo work for it. After a sweep through the HUD, changed
Nodecomponents per frame fell from 9.0 to 0.01, and changed components of all kinds from 40.9 to 10.7. - Right-size the thread pool. The compute task pool had 16 workers on a 24-thread machine, and a nearly idle scene paid for waking them. Two threads took the solo frame from 1.98 ms to 1.70 ms. One thread was faster solo but 0.12 ms slower with 200 players, so we chose two.
Altogether the idle solo scene went from 3.22 ms to between 1.68 and 1.73 ms. The method changed along the way: from the middle of this round we pin the game to fixed CPU cores to cut noise, so the early and late numbers are not a perfect pair.
What did not work in this round:
- Skip idle systems with run conditions. Gating 63 message receivers saved 0.04 ms, which is inside our noise. A skipped system still costs about 0.15 microseconds for its condition, against 0.5 for dispatching it. Slices below a 10 microsecond saving were not worth the correctness risk.
- Run Update on the multithreaded executor. The solo frame went from 1.83 ms to 2.51 ms. Spawning tasks for about 970 tiny systems costs more than it saves.
- Remove the 187
.chain()calls. Removing them mechanically crashed the game on session entry. Most chains encode real orderings, such as spawn then project, and they cost nothing on a single-threaded executor anyway. - Turn off Bevy’s static transform optimization. Solo gained 0.08 ms, and crowds paid 0.07 to 0.28 ms more on the main thread.
Round four: the crowd, and the painter
At 200 and 1,000 players the cost moved. Systems that were rounding errors in the solo scene now ran thousands of times.
One of the biggest items in a crowd is the painter. Xirune has to draw in the order of the original client, and that order is not “sort by depth”. Each object is inserted into the draw list relative to the footprints of the objects already placed. The result is not a total order: sorting the items by a key gives wrong answers. So the algorithm is an insertion, and with 1,000 moving players it ran on every frame.
We kept the algorithm and made it cheaper, and we proved each change against the old one:
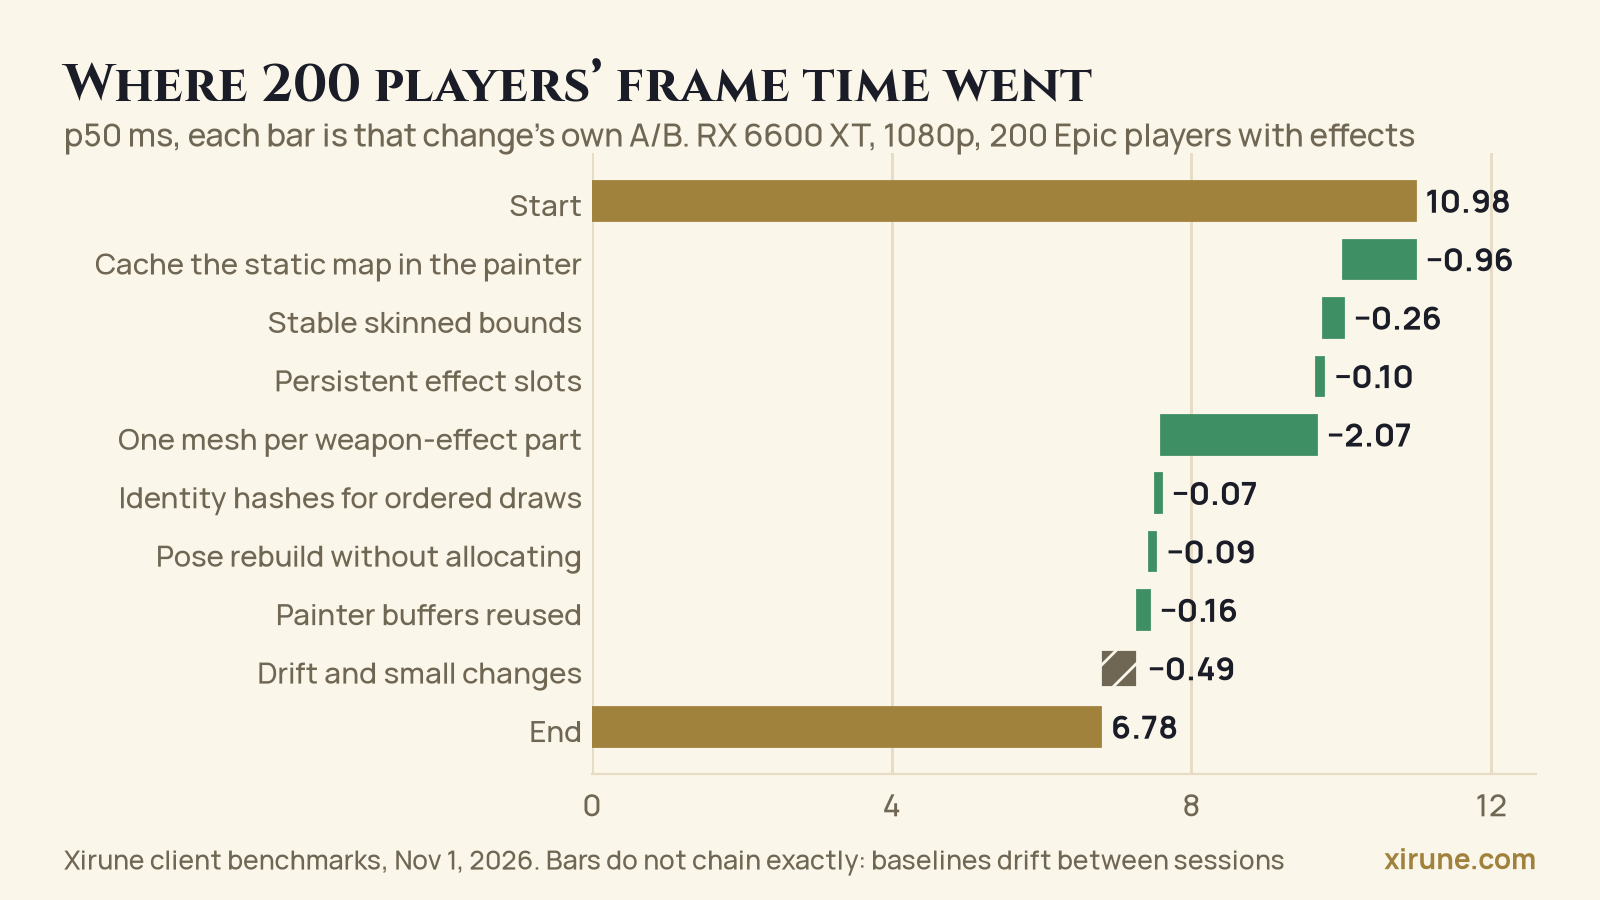
- Cache the static map. Map objects never move, so the map is placed once per signature of its static objects. Each frame only adds the moving groups on top. The old and the new painter produced zero different orders over 15.4 million items on E200 and 19.1 million on Epic-30. E200 went from 11.0 ms to 10.0 ms.
- Reuse buffers. The painter’s scratch vectors are kept between frames. That saved 0.16 ms at E200 and 0.09 ms in the solo scene.
- Index by cell, not by scan. An overlap query used to scan about 6,700 groups linearly, and that was 4 ms of the painter’s 7 ms with 1,000 players. A per-axis cell index answers the same queries from short lists.
- Keep positions lazy. Shifting every later group’s index at each insertion was most of what remained at 1,000 movers. The painter now keeps a position plus a log of insertions and settles it every 32.
Then we merged meshes that no longer needed to be separate:
- One mesh per weapon-effect part, instead of one per layer. E200 went from 9.28 ms to 7.21 ms and the draw count from 877 to 591. This broke the draw order in a subtle way. Layers at equal depth tied, and Bevy broke the tie with recycled entity bits, so merged and unmerged results differed by up to 6,000 pixels. We tagged every effect entity with an explicit part order, and the difference went to zero.
- Bodies, armor and garments through the same multi-draw. With 200 normal-gear players, draw calls fell from about 1,100 to 290, and the frame from 4.38 ms to 3.94 ms.
- Name labels as render items. Labels began as UI nodes. Turning them into render items cut a 1,000-player frame from 31.9 ms to 25.5 ms, and drawing all of them in one pass cut another 26.4 ms to 21.8 ms (two A/B pairs from different sessions). Their quads are now built once when the text changes and only moved at extraction. In the later ablation, labels still cost 2.4 ms.
- Pace the enter. Entering a view with 1,000 players spawned them all in one frame: a 190 ms frame and a 270 ms command flush. Now 40 players load their appearance per frame, and 25 owners get weapon effects per frame. The worst frame is 106 ms.
The chart shows what each of those changes bought at 200 players. Each bar comes from its own alternating A/B, so the bars do not add up to the whole: the 0.49 ms gap is session drift and small changes.
We also checked the allocator. At 1,000 players the client made about 39,000 allocations a frame on the main thread and 68,000 to 83,000 on the others, around 3 to 4 ms of allocator time. A census with sampled backtraces found the top site: every trail rewrote its whole vertex buffer on each 30 Hz tick, 5 to 13 MB per frame. Encoding straight into one retained byte buffer fixed it. Our first version wrote each float through to_le_bytes and made things 3.8 ms worse, with 3.3 million tiny extend_from_slice calls. The second version wrote one slice per vertex pair.
The turn: we were modelling the wrong thing
By November 2 the numbers had improved a lot and the frame was still far from 144 FPS. We then looked at an older client that drew a big crowd faster than ours. It was not a fair comparison, because it skips some of what we must do, such as the exact draw order of the original game. It still made us ask what it does differently.
The answer was not “an older language against Rust” and not “no engine against Bevy”. Our reading is that it keeps one flat record per character and draws the crowd in a simpler order, so it never pays for per-part entities. We cannot copy its draw order. The data layout is something we can learn from.
At that point we had about 240 entities per player: parts, 84 body joints, effect layers and their joints. Every one of them pays for transform propagation, visibility, change detection and extraction. For two days we had removed that cost one system at a time: pull-model joint writers, parallel updates, lane compares, pool sizes. We had modelled render primitives as entities and then spent our time shaving the bill.
Before building more, we ran an ablation on a held 1,000-player session: switch one subsystem off, read the p50. This is the table that set our priorities.
| 1,000 players, p50 ms | Moving | Standing |
|---|---|---|
| Baseline | 32.4 | 20.8 |
| Painter off (plain depth sort) | 22.0 | 12.6 |
| Effects hidden | 19.2 | 14.1 |
| Name labels off | 30.0 | 18.9 |
| UI off | noise | noise |
| Everything but map and bodies off | 9.6 | 5.7 |
Three lessons came out of it.
- The render thread was the long pole. Draw recording took 9.7 ms, the painter 6.8 ms, and uploads about 5 ms. Main-thread wins do not move p50 while the render thread is the longer of the two.
- Casting is expensive because it spawns and despawns. Moving from 0 to 0.5 actions per second per player added 11.6 ms. Every cast creates an effect hierarchy and later deletes it.
- UI costs nothing at this scale, and labels cost 2.4 ms. We parked the UI work.
Release day: baked poses, one mesh per owner
The release shipped with the structural work that this analysis pointed at.
- One merged mesh per owner. Body, hair and weapons draw as a single skinned mesh. A vertex carries its part in
UV_1.x, which picks one of six textures of one bindless material. - Baked bone tables. Each integer frame of a motion is baked once into a GPU buffer and never moves. A character’s record holds its world matrix and a socket matrix, and the shader composes
world × socket × boneitself. Per frame the CPU writes only the changed records, as dirty spans through onewrite_bufferper span. Weapon-effect layers have no joint entities any more. - Trails and particles on the layers’ pipeline. They share the layers’ vertex layout, so they no longer end a merged draw. That removed about 260 draw breaks a frame at 1,000 players.
- Flat grids. Blocked and covered map cells moved from hash sets to a bit grid, where a lookup is one shift and one mask. Puzzle tiles moved from a hash map of chunks to a flat grid with one range per chunk. The painter’s per-cell lists became flat arrays.
- One premultiplied pipeline. Alpha and additive layers now use the same blend state, with no special GPU feature. The shader multiplies colour by alpha and writes alpha 0 for additive layers. Blending
One, OneMinusSrcAlphawith alpha 0 simply adds the colour. The ordered multi-draw merges across both kinds. - Pipeline warm-up. Bevy compiles a material’s pipeline when a mesh that uses it is first queued, and skips the mesh until it is ready. A blend mode nobody had used yet popped in a few frames late. When a map activates, we show one zero-area triangle for each common blend pair, for 120 frames, which makes Bevy queue every pipeline up front. A zero-area triangle rasterizes nothing.
- GPU buffers sized for a crowd. Resizing a shared buffer marks every C3 material modified, 3,694 of them at 1,000 players. Growing from a few bytes while a crowd entered re-prepared them 14 times, and that was the enter hitch. The buffers are now sized for a crowd up front.
A detour that shows how this went: at midnight we parallelised the joint writes. Each joint pulled its own matrix from a per-part pose in a par_iter_mut. Eight hours later the baked tables made the joint entities unnecessary, and we deleted the code we had just written. Parallelising work you can delete is a good way to feel productive.
The release notes say about 31 ms for the 1,000-player test. Between the first test and the release, three builds measured 38.5, 29.7 and 32.4 ms in separate sessions. The last one reads slower than the one before it, because features from other lanes landed in between, such as the native shadow work and a new HUD layout, and we have no clean A/B between them. Measured again later on the rig that tested main, the release build itself read 37.1 ms, not 31. The sessions and rigs differ, which is why the comparison with main further down is the one to trust.
Two more numbers from the builds of those two days: the 200-player scene fell from 6.27 ms to 4.05 ms. The solo scene stayed at 1.78 to 1.79 ms, which tells us that none of this crowd work taxes the quiet case.
What did not work
The dead ends are the part we would most like another team to read.
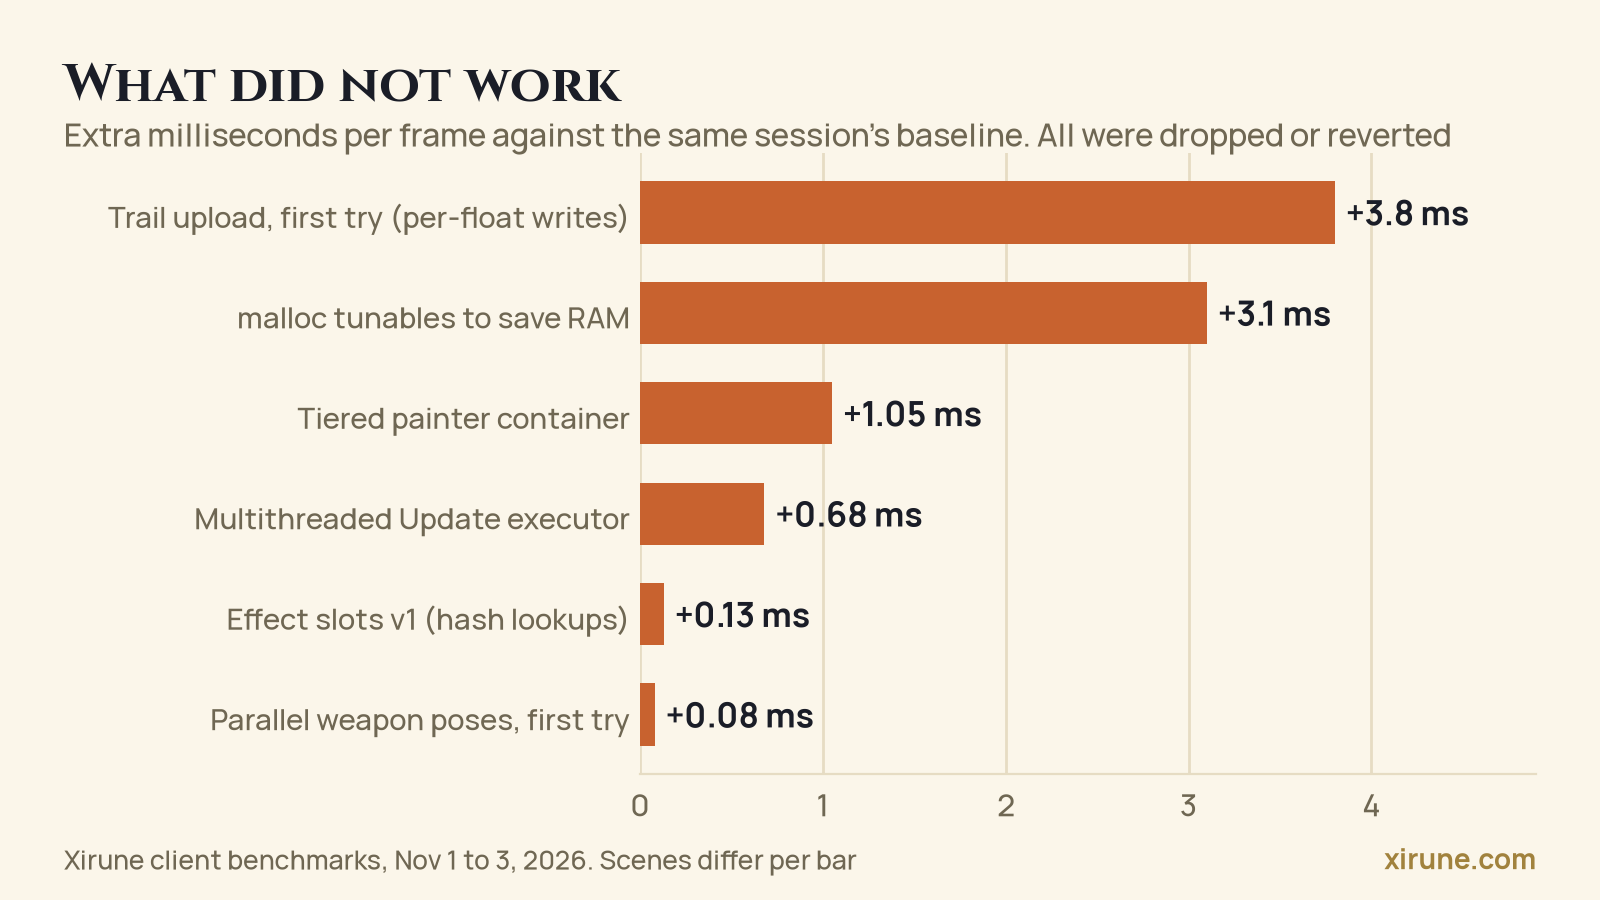
A few of them in more detail:
- Tiered painter container. The painter keeps its placed groups in one vector, and inserting into the middle moves a lot of memory. We replaced it with a tiered vector of small chunks, expecting a 3 KB move instead of a 180 KB one. In an alternating test at 1,000 players it lost 1.05 ms: 35.26 ms against 34.20 ms for the plain vector. We did not chase the reason. The plain vector won, so the tiered container is gone.
- malloc tuning for memory. The client holds about 1.8 GB at 1,000 players. Every glibc trim or mmap tunable returned about 340 MB, and cost 0.6 ms at 200 players and 3 ms at 1,000, because each large per-frame buffer became an
mmapand a page-fault storm. Not shipped. - An incremental paint-object list. It was exact over more than 3,000 frames and not faster. Only about 1,900 of 7,200 surfaces are static map objects. The other 5,300 role and effect parts still need the per-frame ancestor walk, and the change filters cost about what they saved.
How we work with AI agents
Most of the code and almost all of the measurements in this post were produced by AI agents. One human owner steers them. We think that is worth describing, because the dead ends above are the reason the setup looks the way it does.
The owner decides what and whether. The owner sets the target, chooses the scope of each round, and approves anything that reaches players: releases, deployments, uploads, deleting data. Product trade-offs stay with the owner. Anti-aliasing stays an option with Off as the default. The 75 percent render scale was removed. Changes to how shadows look were approved by the owner before they landed. Exact draw order stays exact, and nobody gets to trade it for frame time.
A conductor plans and splits the work. One agent turns a goal into lanes. A lane has a ticket, a scope and a list of files it may touch. The conductor hands lanes to workers, answers their questions, decides what can run in parallel, and takes decisions to the owner. When the owner is asleep it holds the line: no deploys, no publishing, no closing issues.
Workers each own one lane in one worktree. A worker has its own copy of the repository, its own local World server and its own game instance, with no shared databases. It commits small slices and rebases before it pushes. Logs, screenshots and raw frame histories go to a shared artifacts folder outside the repository, so claims can be checked later. A worker does not touch another lane’s files. When two lanes met at one file, the conductor granted a narrow seam in writing.
A reviewer reads and does not edit. A separate agent reads the code and the measurements and writes plans and rulings. It was useful and often wrong, which we come back to below.
Every claim is measured
The rules in this post were written for agents, and they apply to people as well.
- Same-session A/B. A candidate and its baseline are separate builds, run alternately on the same machine, at least twice. A number from another day is not a baseline.
- Exact probes for anything that must not change. Draw order, vertex bytes, pose matrices and action timings are compared old against new, in the same session, with a mismatch count. The accepted count is zero. We do not use a test suite for this. A probe runs against live recorded frames, and it is removed before the timing runs.
- Timing holds. There is one machine for timing. A worker asks for a window, nobody else builds or runs a game during it, the CPU is sampled for foreign processes through every run, and the worker announces that timing is done the moment it is. Runs that overlapped a compiler, a second client or a pacing glitch are excluded and listed with the reason.
- Adoption thresholds. A change lands if it clears a stated number. Changes that land inside the noise are parked or dropped, even when the idea is attractive. One of ours was left for the owner to decide because it won in a walking crowd and lost in a standing one.
Review, verify, repeat
A worker’s report is a claim with attachments: the exact command, the raw frames, the screenshots, the probe output. The conductor and the reviewer read the evidence, ask for a rerun when a result looks off, and send work back. Typical corrections: a number was an unfiltered mean that contained a known outlier, a fixture database left over from an earlier run had broken a batch, a result needed a second pair of runs before anyone believed it. A change goes to the owner only after its gates are green and the evidence is in the folder.
Why measurement beats confidence
The agents are fluent, and confident, and wrong in specific ways. The record is in this post:
- Our first big wins were fake. The glow effects were not being drawn, and fewer pixels made the frame faster.
- The reviewer projected 9 to 11 ms at 1,000 players. The measured result was about three times higher, and the reviewer said so and wrote a rule for itself: no projection without a timeline of one frame by thread.
- Removing joint entities was expected to save 4 to 6 ms. The profile said about 2 ms of a 36 ms frame.
- The tiered painter container was designed carefully and lost 1.05 ms.
- A parallel joint writer was built, measured as sound, and deleted the same day when the data model changed under it.
None of those was caught by reading the code harder. Each one was caught by a number. That is the working rule: an agent’s confidence carries no weight, and a measurement from a clean A/B carries all of it.
What this does not mean
It does not mean the work runs itself. The owner spends real time on scope, review and decisions, and the reviewing is most of the cost. The agents also repeat mistakes across lanes until a rule is written down, which is why the repository now has a page of performance rules that every worker reads before it starts. We do not claim it is cheaper than a team of people in every case. It is faster at this kind of loop: measure, change one thing, measure again.
This post was drafted the same way. A worker wrote it from the measurement artifacts, every number was traced back to a recorded measurement before it went in, and the owner reads it before anyone else does.
After the release: the painter and the shadows
Right after the release, the painter and labels work landed on main. It is not in a release yet. This is the cleanest measurement in the post: the release build and the current main, alternated on one rig, 20 runs in total.
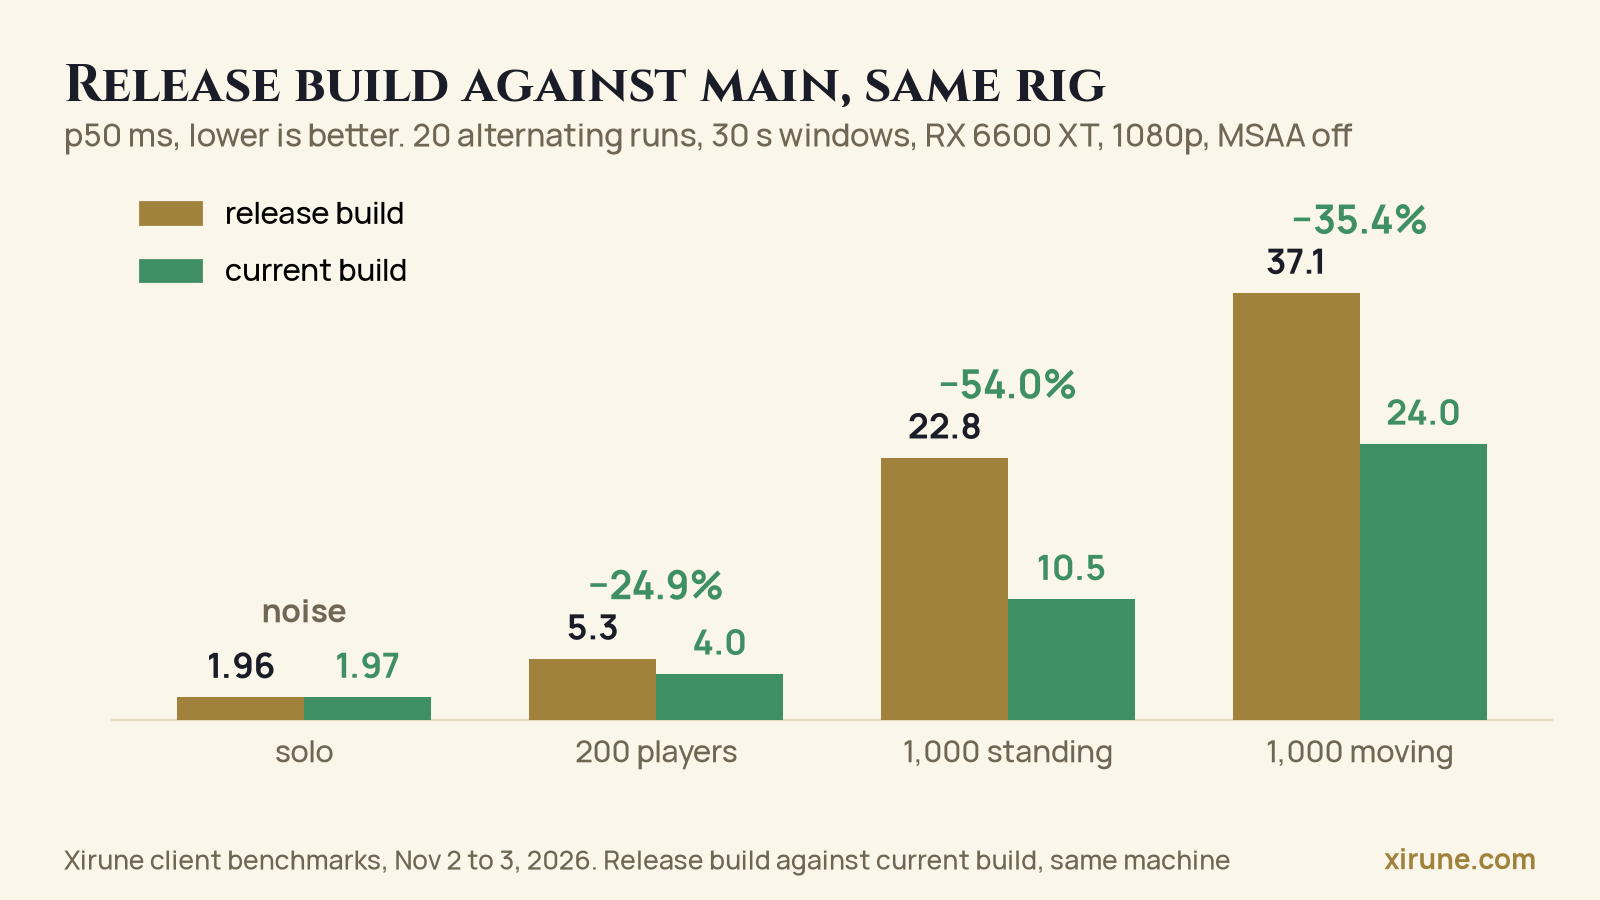
| p50 ms | Release build | Current main | Change | Max draws, before to after |
|---|---|---|---|---|
| Solo | 1.961 | 1.972 | noise | 64 to 63 |
| 200 players | 5.314 | 3.989 | -24.9% | 528 to 154 |
| 1,000 standing | 22.797 | 10.489 | -54.0% | 2,142 to 119 |
| 1,000 moving | 37.140 | 24.002 | -35.4% | 2,265 to 373 |
Solo does not move, which is what we want from crowd work. At the 95th and 99th percentile the 1,000-player moving scene reads 26.8 ms and 28.1 ms. That is about 41 frames per second of throughput, not 60. The memory side is mixed: peak RSS fell for the standing crowd and rose by about 118 MiB for the moving one. These are release-against-main comparisons, so they cover everything that changed in between, and we do not attribute them to individual commits.
What landed:
- An exact painter that costs less. The painter keeps the native insertion order, so the lever is the data structures. A generation-safe flat table indexed by entity, dense arrays for the placed groups, and per-cell lists of the static map that are computed once and cached as flat ranges. Native insertion decisions are unchanged. We compared the old and the new painter on identical live-recorded frames, in both the cached and the full-rebuild path: zero mismatches across at least 4,800 solo, 2,700 200-player and 900 1,000-player comparisons.
- The tiered container is gone. The one we tried first is the +1.05 ms entry in the dead-ends chart above. Our explanation, that its bookkeeping and traversal cost more than the memory moves it saved, is inferred from the code and not isolated by a measurement.
- The painter memos stay. A quiet forced full rebuild costs about 6.7 ms and our rule is to delete a cache only when the rebuild is under 2 ms. It is not.
- Labels. Quads and bind groups are cached, a moving label updates 8 bytes per quad, and only labels that intersect the viewport are extracted.
The draw-break census, again
The census from the previous round told us where merged draws were ending. The shadows were the cause: every owner drew a shadow with a standard material just before its body, which ended a run for each player. Default and custom image shadows now go through the same ordered pipeline as everything else.
| Mean per frame at 1,000 players | Before | After |
|---|---|---|
| Runs ended by another draw in between | 997.5 | 5.4 |
| Runs ended by a pipeline change | 135.9 | 207.0 |
| Ordered runs | 1,134.5 | 213.5 |
| Commands | 6,040.1 | 7,011.5 |
Runs fell 81 percent. Commands rose, because the 1,000 shadow quads now take part in the batching. Pipeline breaks rose as well, and we read that as the cost of the shadows now being visible to the batching at all. Instance gaps, index formats, materials, slabs and missing commands stay at zero. This census is a diagnostic from a dev-tools build, not a frame-time claim.
Shadows that match the original look
The shadow rework was also a fidelity fix. The default shadow now matches the original look: the same shadow bitmap, anchor, scale, 178/255 opacity and fade. A custom shadow image swaps only the art on the same pipeline. The Realistic shadow projects from a point light and reuses the character’s existing joints instead of an extra set of projected ones.
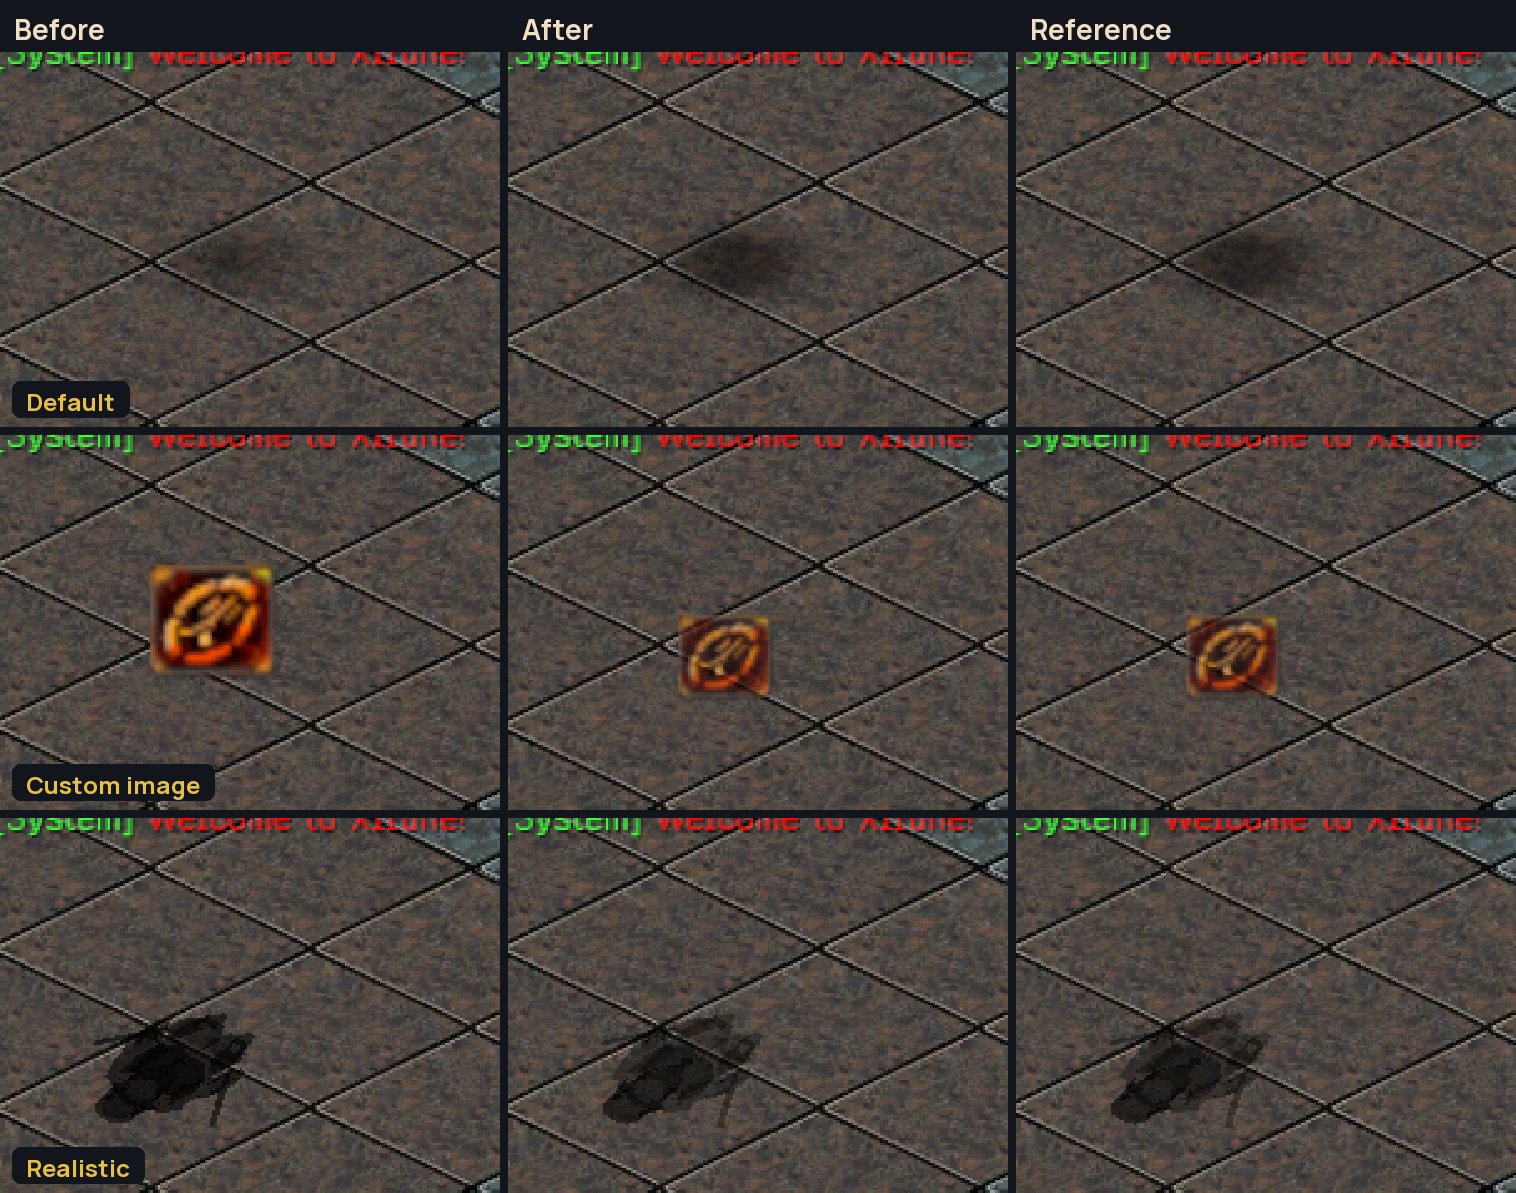
The right column is not a screenshot of the original game. It is a reference image we rendered independently from the original shadow art and the posed character geometry. Against it, the default shadow differs by 0.08 of an 8-bit level on average and 0.52 at most. A coloured custom shadow differs by 0.21 on average and 1.96 at most. The Realistic silhouette overlaps the reference at 0.9994 intersection over union, with an interior error of 0.04 on average, and no mismatch beyond a one-pixel edge band.
The ablation, again
We repeated the ablation on the final build, switching one subsystem off at a time and reading p50.
| p50 ms | 1,000 moving | 1,000 standing |
|---|---|---|
| Base | 23.9 | 10.5 |
| Painter off (diagnostic only) | 20.4 | 10.9 |
| Effects off | 10.3 | 5.7 |
| Labels off | 24.8 | 10.1 |
| UI off | 25.1 | 10.6 |
| Effects, labels and UI off | 11.1 | 5.1 |
| Everything but map and bodies off | 8.1 | 4.8 |
| Base again | 27.6 | 10.6 |
Read it with care. The moving scene drifted from 23.9 ms to 27.6 ms over the round, so the small label and UI deltas in that column mean nothing. Two lines are large enough to trust. Hiding effects takes the moving scene from 23.9 ms to 10.3 ms, which is 13.5 ms, and it takes the standing scene from 10.5 ms to 5.7 ms. Effects are still the biggest block. The painter changed a lot: turning it off used to save 10.4 ms moving and 8.2 ms standing, and now saves 3.4 ms moving and nothing standing. The painter is no longer where the time goes.
Second pass: casts stop building skeletons
Effects were still the biggest block in the ablation, so the second pass started there. Same rig as before: RX 6600 XT, 1080p, anti-aliasing off, release build with dev tools, 30-second runs.
A cast used to build a skeleton for every layer. One joint entity per layer, and bone matrices computed on the CPU every frame. Now a cast writes one small record. Each layer plays from the same baked pose tables as the character, and the shader reads the clock. It is the idea from the next-steps section of the first version of this post, and it worked.
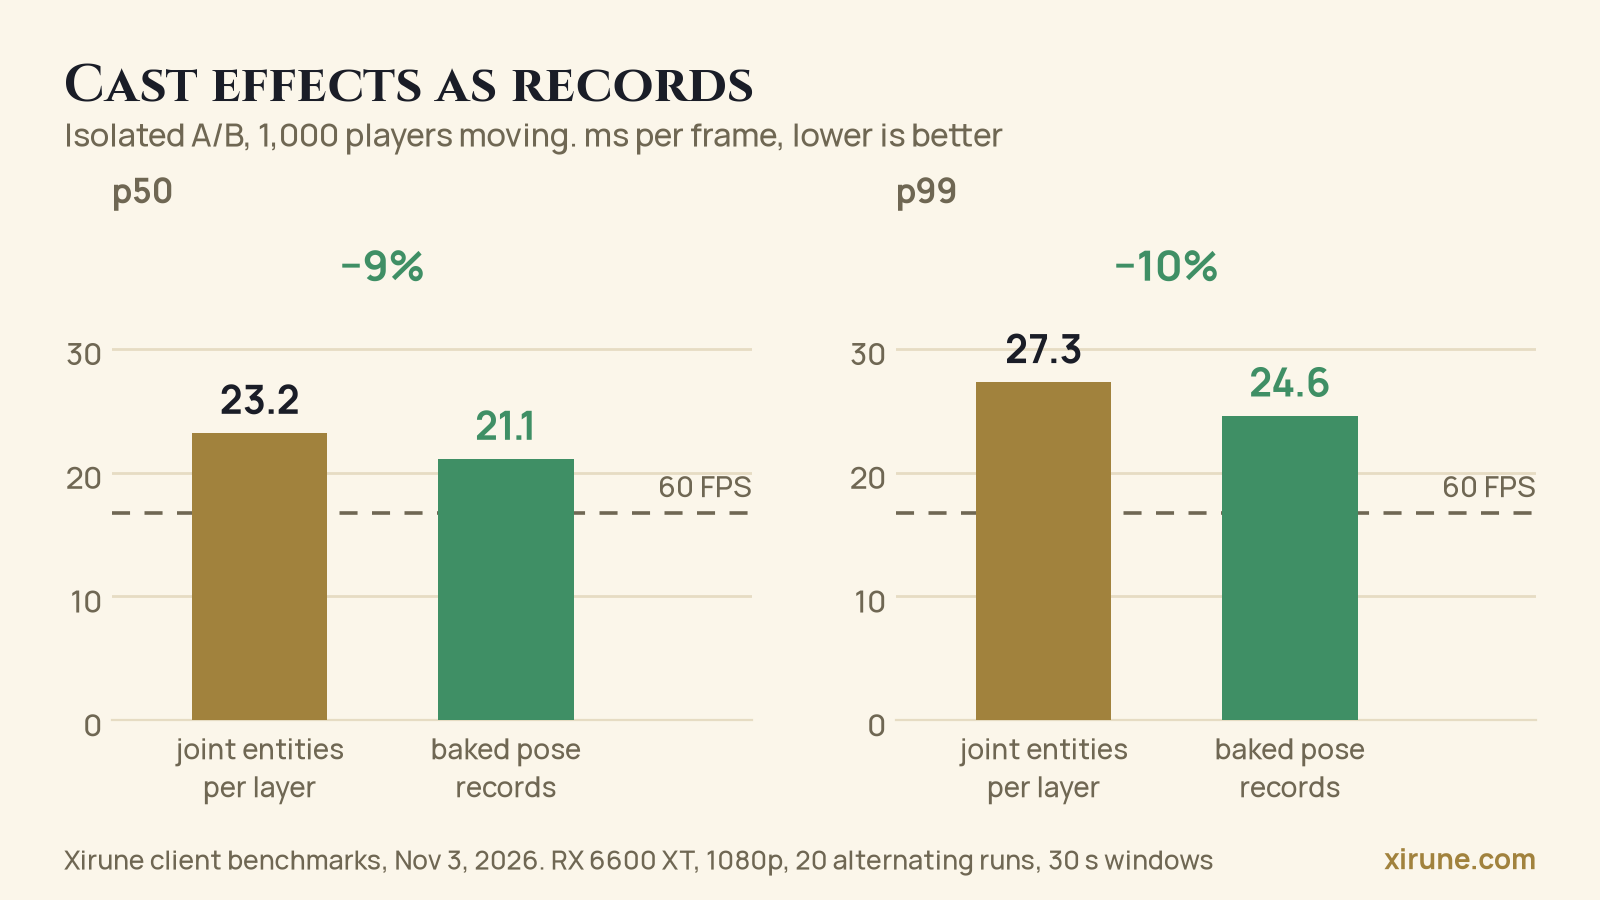
In an isolated A/B against the build before it, 1,000 moving players went from 23.2 ms to 21.1 ms. The other scenes stayed inside the noise.
Nothing was allowed to change on screen. All 20 frozen parity scenes matched the old output outside the name labels, and 19 matched exactly. The 20th swaps normal KO labels that tie on entity id, which two copies of the old build do as well.
Half-rate animation is gone. Distant characters used to skip animation frames. The original client animates every visible character every frame, so we dropped our shortcut. Monsters now read the same baked pose tables as players.
Merged, the gain is smaller than the isolated one. The two changes were measured in different sessions, so the merged build is the number to read. With the new option off, the 1,000-player moving scene is 0.5 to 1.1 ms better than the 23.2 ms baseline of the same day, and up to 8 percent better than the 24.0 ms earlier in this post. That is less than the 2.1 ms the isolated change showed, and we do not know yet where the rest went. Every moving frame is still over 16.7 ms.
| Merged build, p50 ms | Solo | 200 players | 1,000 standing | 1,000 moving |
|---|---|---|---|---|
| Default settings | 2.03 | 3.8 to 4.0 | 11.9 | 22.1 to 22.7 |
Fewer 3D models, same crowd
The original client has a trick for big crowds, and we borrowed it. When the number of characters on the map reaches a threshold, idle players stop being drawn as live 3D models. Each becomes a flat picture of itself. We rebuilt it as Display, Graphics, Number of 3D Models. Like the original, it is off by default. Turn it on and you pick the number. The default is 20.
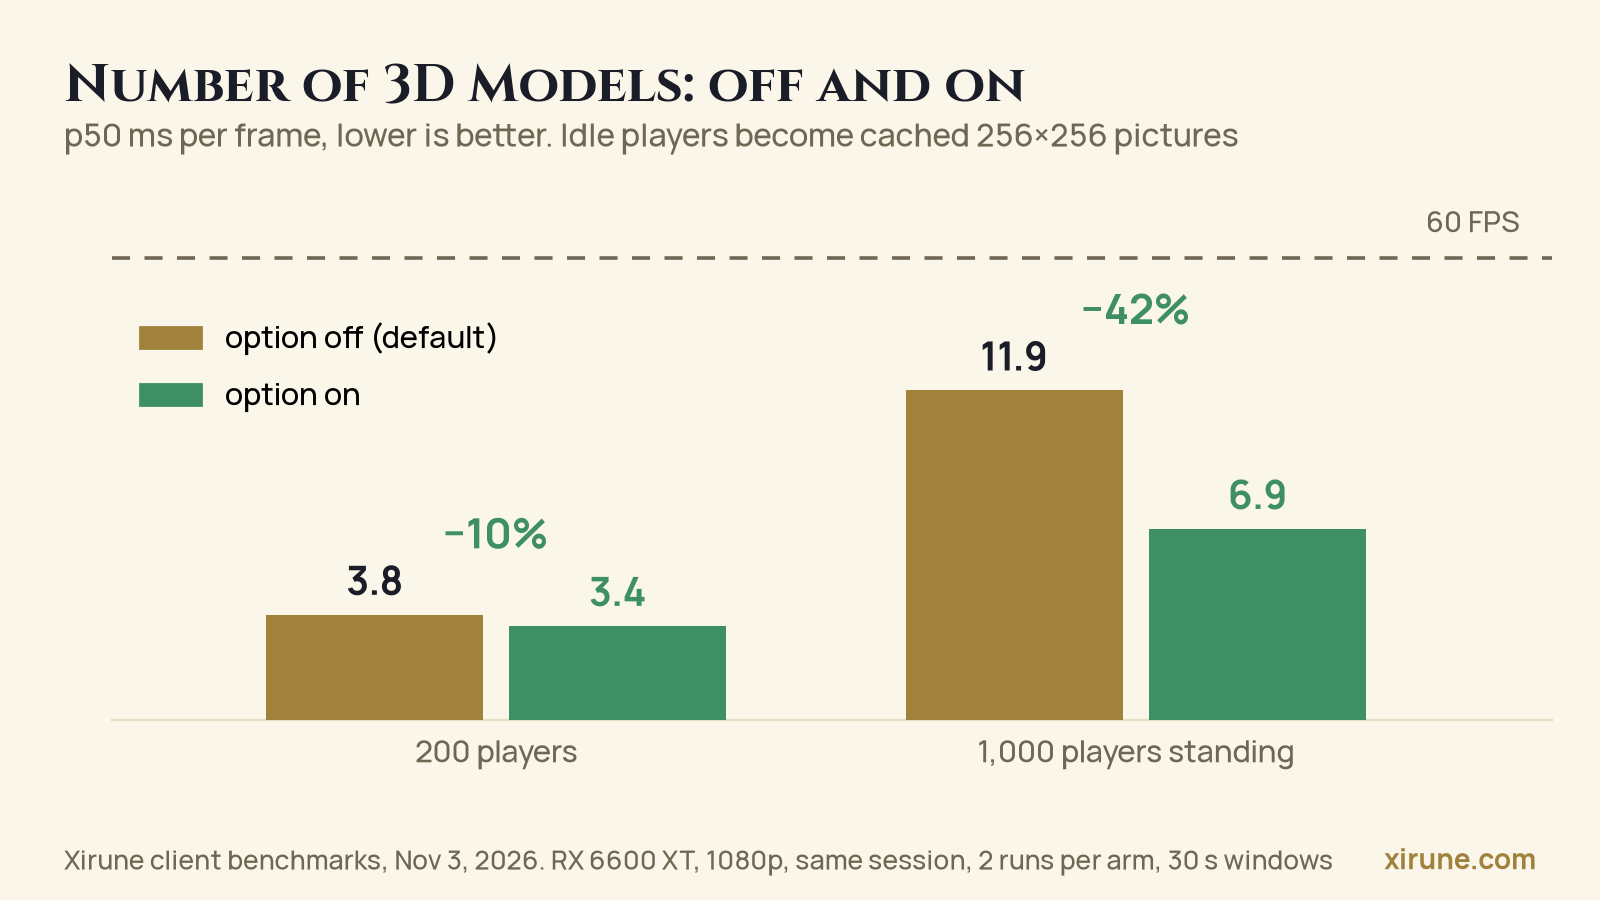
The standing 1,000-player crowd drops from 11.9 ms to 6.9 ms, a 42 percent cut. At 200 players the gain is 10 percent. These are p50 numbers from the final A/B round: two runs per arm, one session.
How it works:
- A character idle for at least five seconds is drawn once into a 256 by 256 picture. The picture takes the painter slot of the 3D model it replaces, so the draw order does not change.
- The pictures live in one shared atlas, so they batch together.
- Players who move stay full 3D. A crowd on the run looks and costs what it did.
One part is ours, not the original’s. We re-capture the picture when a character changes how they look: gear, facing, a status or aura, a mount, a transformation, or a camera zoom or rotation that changes the view. We did not find these triggers in the original, so a stale picture is a risk we chose to remove. Panning the camera, hit points and animation clocks do not trigger a capture.
The tail shrinks less than the middle. With the option on, the 99th percentile of the standing 1,000-player scene is 17.0 to 17.6 ms, against 22.4 ms off. The first capture of each picture happens inside the measured window, and we left it in on purpose.
An earlier build of this option was slower at 200 players and drew black cards behind the characters. The numbers above are from the version that draws the pictures through the shared atlas. We have not measured 1,000 moving players with it, because moving players do not use it.
Hide the crowd yourself
Two more settings let you cut a crowd down by hand.
Tab and Space hides other players, the way the original client does. Friends stay. Everyone else disappears. You, monsters and NPCs are untouched, and names and health bars stay. Effects that belong to a hidden player stop being drawn but keep their clocks, so they carry on where they were when you show players again.
The Display options hide wings, gear glow and skill effects, separately for your character and for other players. Hidden layers are never built, and a hidden player’s skill effects are dropped before the effect system admits them.
We did not measure these as frame-time wins. What they save depends on your scene.
What is next
The target is still 144 FPS under load. The moving 1,000-player scene is at about 22 ms, down from 46 ms in our first test. The draw side is mostly solved and cast effects are records now. What is left is render preparation and the work on the main thread.
- Render preparation. In our last trace of a moving crowd the render thread was the long pole at about 19 ms. Inside it the painter’s ordered insertion took about 7.5 ms, plus about 0.8 ms to prepare the order and 0.8 ms for batching. That trace is from before the second pass, so we will take a fresh one on the merged build before we promise a number. The order stays native.
- Spread animation, gear and effects over more cores. Gear shapes and gear mesh records still take about 1.4 and 0.9 ms on the main thread.
Our target for the next round is 16.7 ms with 1,000 players moving, which is 60 FPS in that scene and still not 144. We will repeat the ablation afterwards. We have been wrong with estimates before: an early projection of 9 to 11 ms at 1,000 players was about three times too optimistic.
Numbers, and how to check them
All frame times are p50 unless the text says otherwise. All of them come from a Ryzen 9 5950X with an RX 6600 XT at 1080p, from release builds, but not all from the same session or rig set-up. Scenes with synthetic crowds are not server-load tests. Absolute numbers drift between sessions and rigs as the game changes, so compare numbers only inside one row of the table below. When two measurements disagreed, we quote the later one and say which build and session it came from.
| Number | Build | Session |
|---|---|---|
| 46 ms to about 31 ms | 1,000 players, first test and the November 2 release | the release notes for 2026.11.2-1 |
| 46.3 ms | the Nov 1 build with merged effects and label cache | Nov 1 |
| 38.5, 29.7 and 32.4 ms | three builds from Nov 2, before the release | Nov 2, separate sessions |
| 37.1 ms to 24.0 ms | release build against current build, same machine | Nov 2 to 3, one rig, 20 alternating runs |
| 23.2 ms to 21.1 ms | cast records, isolated A/B, 1,000 moving | Nov 3, one rig, 20 alternating runs |
| 22.1 to 22.7 ms | merged build, 1,000 moving | Nov 3, two sessions, two runs and one run |
| 11.9 ms to 6.9 ms | Number of 3D Models off and on, 1,000 standing | Nov 3, one rig, two runs per arm |
If you want to try this on your own project, the method transfers better than any single trick:
- Pick a scene with a written contract, and keep every frame of it.
- Measure uninstrumented first. Profile separately. Never A/B a profile.
- Change one thing, build separately, alternate runs, repeat.
- Prove that the picture did not change, on moving content.
- Write down what did not work, with the number.
We went from 46 ms to about 22 ms and the target is 6.94 ms, so there is more to do. Xirune is in closed beta, and the crowds you see in the game are the ones we have been tuning. If a scene still drops frames for you, tell us where, and which hardware you play on. That is the data we cannot get from a synthetic crowd.
Want to be next? Join the waitlist · Get the launcher · Join us on Discord